Spreadsheet-heavy operations
The same data is entered more than once, versions disagree, and status updates depend on asking people one by one.
HEAD OF IT × SYSTEMS CONSULTING
I am Jerry Yeh. From team delivery to workflow improvement, I help organizations clarify costs and risks and prioritize what to improve.
We do not need to start with technology. If these problems keep coming back, the workflow, data, or system ownership needs to be sorted out.
The same data is entered more than once, versions disagree, and status updates depend on asking people one by one.
Customer, order, warehouse, finance, and reporting data live in separate places, so every change creates more manual work.
Incidents depend on whoever is available. Without records, alerts, and a repeatable recovery process, the same failure returns.
01 / TECHNOLOGY LEADERSHIP
Enterprise technology leadership
Keep teams and core systems aligned with business goals.
Clarify investment and delivery priorities, establish ownership, and reduce recurring firefighting.
02 / WORKFLOW AUDIT
Operational workflow and system improvement
Identify process costs before choosing improvements.
Map repetitive work, disconnected data and manual risks; compare phased options without assuming a new system is required.
Estimate the monthly cost of a repetitive workflow and the amount potentially recoverable through practical automation. This is a baseline, not a reason to force AI or SaaS into the process.
Formula: people × hours × loaded hourly cost + error/delay cost. A formal Audit also includes waiting time, rework, penalties, refunds, opportunity cost, and steps that must retain human judgment.
Discuss a Workflow AuditA is an active financial-platform risk scenario; B is a logistics improvement with measured results; C is an audit-ready small-business workflow. Only B is presented as a verified outcome.
Fake registrations and abusive traffic can overwhelm onboarding, block legitimate customers, create conversion loss for Sales, trigger incident work for IT, and expose management to brand and operating risk.
Audit focus: Separate the pain owner, technical owner, and economic buyer; quantify conversion and brand impact before choosing a protection investment.
Before the change, the operation averaged about 10 shipping errors per month at roughly US$100 direct loss each. Investment included two scales at about NT$24,000 and a product/weight validation system at about NT$180,000.
Result: Errors fell from 10 to 2 per month—approximately 80%. Basic direct error cost fell from about US$1,000 to US$200 per month, excluding reshipping, support, labor, and carrier penalties.
Attendance, leave, overtime, and payroll calculations often span forms, spreadsheets, and manual reconciliation, creating repeated entry, follow-up, month-end closing, and correction work for owners, HR, and Accounting.
Audit focus: Map attendance-to-payroll calculation, spreadsheet reconciliation, approvals, and notifications; solve with existing tools and lightweight scripting before assuming a SaaS build.
These figures come from the ticket, registration, deposit, and withdrawal reports included in the 2026-05-21 résumé materials. Metrics without supporting records are excluded.
CI/CD, monitoring, and standardized governance improved issue ratio from 73% in 2024 to 3% in 2026.
| Period | Issue Ratio % |
|---|---|
| 2022 | 80 |
| 2023 | 58 |
| 2024 | 73 |
| 2025 | 17 |
| 2026 | 3 |
| Period | Critical Count |
|---|---|
| 2022 | 7 |
| 2023 | 33 |
| 2024 | 52 |
| 2025 | 13 |
| 2026 | 7 |
Effective registrations grew from 62 in 2021-10 to a peak of 3,873 in 2024-01 while platform operations remained stable.
| Period | Effective Registrations |
|---|---|
| 2021-10 | 62 |
| 2022-01 | 95 |
| 2022-04 | 165 |
| 2022-07 | 267 |
| 2022-10 | 147 |
| 2023-01 | 276 |
| 2023-04 | 232 |
| 2023-07 | 2,420 |
| 2023-10 | 1,656 |
| 2024-01 | 3,873 |
| 2024-04 | 2,218 |
| 2024-07 | 1,710 |
| 2024-10 | 1,086 |
| 2025-01 | 725 |
| 2025-04 | 785 |
| 2025-07 | 1,002 |
| 2025-10 | 694 |
| 2026-01 | 844 |
| 2026-04 | 704 |
Supported over US$60.5M in total deposits and US$15.36M in cumulative net deposits.
| Period | Deposit Amount (USD) |
|---|---|
| 2021 | 415,287.28 |
| 2022 | 6,068,479.0 |
| 2023 | 12,416,975.72 |
| 2024 | 20,328,864.42 |
| 2025 | 16,207,275.54 |
| 2026 | 5,107,661.37 |
| Period | Net Deposit (USD) |
|---|---|
| 2021 | 236,370.23 |
| 2022 | 3,126,505.97 |
| 2023 | 1,567,116.66 |
| 2024 | 5,972,739.14 |
| 2025 | 4,003,412.46 |
| 2026 | 449,662.68 |
The platform needed to support high-volume registration, deposit, withdrawal, campaign, and partner workflows.
Implemented GitLab CI/CD, Log4net, Grafana, Jaeger, Trudesk, and standardized incident processes.
Supported 3,873 peak monthly registrations, US$60.5M deposit operations, and approximately 12 hours annual production downtime.
Warehouse, logistics, orders, e-commerce channels, and field operations needed integration.
Built PBSC ERP, Heptarun, Driver Tasker, and WMS with integrations such as Walmart, BigCommerce, Gmail API, RabbitMQ, and Kafka.
Enabled inventory control, inbound/outbound workflows, driver tasks, real-time tracking, digital signatures, and multi-channel order synchronization.
Agile Delivery, SDLC, Incident Management, Change Management, Release Governance, Stakeholder Communication, Root Cause Analysis
C#, ASP.NET MVC, ASP.NET Core 8, WinForms, REST APIs, CRM Systems, Trading Platform Operations
React, ReactJS, JavaScript, HTML5, CSS3, Ant Design
MySQL, MSSQL, MongoDB, operational reporting, data analysis
GitLab CI/CD, Jenkins, Grafana, Jaeger, Log4net, deployment automation, monitoring workflows
RabbitMQ, Kafka, Selenium, Katalon, Mikrotik RouterOS, Active Directory, Power BI










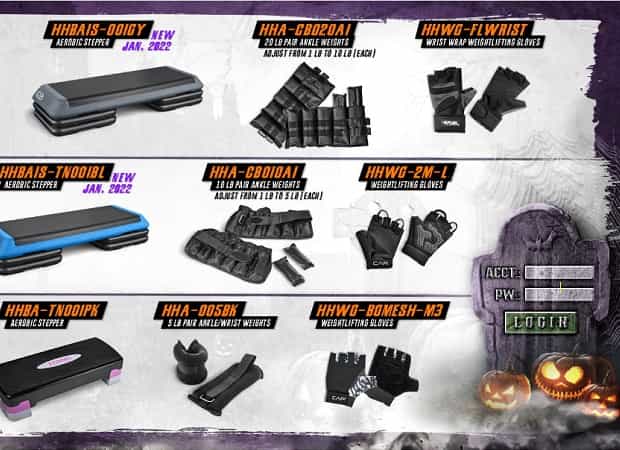
Procurement, inventory, orders, and multi-channel e-commerce integration.

Real-time container tracking, driver dispatch, and automated billing.
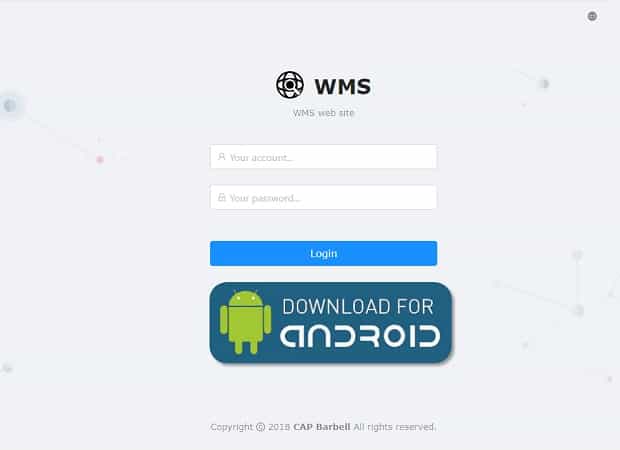
React-based WMS for inventory, capacity, and workflow management.

iOS / Android driver task and proof-of-delivery apps.

Katalon / Selenium automation for web and mobile validation.
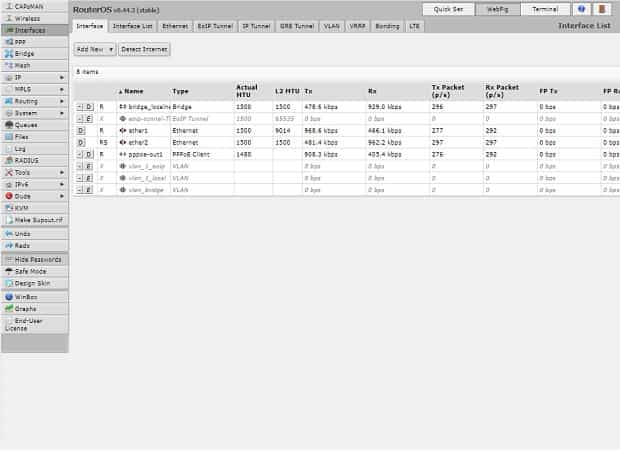
Enterprise routing, firewall, VPN, and network management.
Submit a secure inquiry using the form below.